90 Day AI Agent Analytics Plan: Six KPI Layers for Customer Service
90 Day AI Agent Analytics Plan: Six KPI Layers for Customer Service
Insights
12 min
AI agent analytics measures whether your AI customer agent actually resolves issues, protects the customer experience, and lowers cost, not just how many chats it handles. The discipline runs on six KPI layers: containment and resolution, quality and safety, customer experience, agent experience, automation path analytics, and business value. Track all six together, because a business owner who only watches containment will miss the moment “efficient” starts meaning “frustrating.”
TL;DR:
Focusing solely on containment rate can overlook issues like fallback prevalence and customer satisfaction, which require tracking solution rate and journey completion.
Implementing issue-level tagging and weekly quality sampling helps identify specific workflow failures and reduces fallback rates by up to 50 percent.
Real-time operational dashboards should monitor containment, escalation reasons, and hallucinations, while monthly executive reports must translate data into cost and satisfaction impacts.
Building a continuous improvement cycle involves daily alerts, ownership assignments, flow updates, and regression testing against historical logs before deploying changes.
Using an integrated no-code platform like Droxy streamlines KPI collection across channels, enabling quick pilot tests and consistent performance measurement.
Table of Contents
What Is AI Agent Analytics, and Which KPIs Matter Most?
What Should You Instrument to Measure AI Agent Performance?
How Do You Build Dashboards That Ops and Leadership Both Trust?
How Do You Turn These Metrics Into Ongoing Improvement?
How Droxy Fits This Measurement Framework
My 90-Day Plan for Getting This Right
Ready to Put This Framework Into Practice?
Sources
What Is AI Agent Analytics, and Which KPIs Matter Most?
AI agent analytics is the practice of measuring performance, usage, and business impact for AI agents handling customer conversations across chat, phone, WhatsApp, and social channels. NiCE’s six-layer framework organizes this into core operations, customer effort, agent experience, automation analytics, risk and governance, and business value, and it’s become the closest thing this space has to a standard.
Here’s how each layer breaks down into specific KPIs, formulas, and healthy target ranges.
Core operational KPIs track speed and throughput:
Time-to-first-response: seconds to first meaningful reply. Healthy AI benchmarks sit under 5 seconds for chat.
Effective average handle time (AHT), rethought for AI: measure resolution time per issue, not per message, since a single AI conversation often replaces three human touches.
Throughput and service level: conversations handled per hour versus the percentage answered within your target window.
Customer effort and experience KPIs catch what containment hides:
Customer Effort Score (CES): a one-question survey (“How easy was it to resolve your issue?”) asked right after AI-led resolution.
CSAT segmented by AI involvement: compare satisfaction for fully-automated resolutions versus human-assisted ones, not one blended score.
Journey completion rate: did the customer finish the task, or abandon mid-flow?
Repeat contact rate: the customer coming back within 48 hours about the same issue is the clearest sign that “resolved” wasn’t real.
Agent experience KPIs matter when AI hands off to humans:
Agent experience index: a composite of handoff friction and rework time.
After-call work (ACW) reduction: minutes saved on notes and follow-up when AI pre-fills case context.
Human override rate: how often a human corrects or reverses an AI action.
Time-to-competency: how fast new agents ramp up when AI handles routine volume.
Automation analytics goes beyond simple containment. Rasa recommends treating solution rate, meaning customer-confirmed resolution, as the north star instead of raw containment percentage, because containment counts a conversation that ended, not one that actually solved anything. Track fallback rate (how often the agent punts to a human or a generic answer) and automation path analytics: which decision paths customers take most, and where loops occur.
Quality and safety KPIs protect the brand: hallucination rate, KB hit rate (how often a real knowledge-base article backed the answer), policy violation rate, and confidence-threshold breach rate (how often the agent answered despite low confidence).
Business value KPIs close the loop: cost per resolved interaction, deflection rate, revenue impact from AI-assisted conversions, and payback period on the deployment itself.
What Should You Instrument to Measure AI Agent Performance?
Good analytics starts with good logging. If you’re not capturing the right events at the conversation level, no dashboard downstream will save you.
Log the core event set for every interaction: session ID, hashed customer ID, channel, entry point, one or more issue tags, a KB-hit boolean, a confidence score, an escalation flag, timestamps for key events (first response, resolution, handoff), and a cost marker per interaction.
Tag at the issue level, not just the conversation level. Rasa’s guidance on contact center metrics is blunt about this: a single conversation can touch three separate issues, and conversation-level tracking blends success and failure into a number that means nothing. Issue-level tagging shows you exactly which workflow broke, even inside a conversation that “looks” resolved.
Run a weekly quality sample. Pull 50 to 200 responses, weighted toward edge cases and low-confidence answers, and have a human or an LLM-assisted reviewer label each for hallucination, partial correctness, or full accuracy. This is how you actually compute a hallucination rate instead of guessing at one.
Export top fallback topics every week and run a top-10 KB update cycle. eesel AI’s benchmark work found that fixing the ten most common fallback topics typically cuts fallback rate by 30% to 50% per cycle, which is the single highest-leverage habit in this whole framework.
That’s where hallucinations cluster, and it’s where five minutes of review time finds the most problems.*
How Do You Build Dashboards That Ops and Leadership Both Trust?
Different audiences need different views of the same data, and trying to serve both with one dashboard usually serves neither.
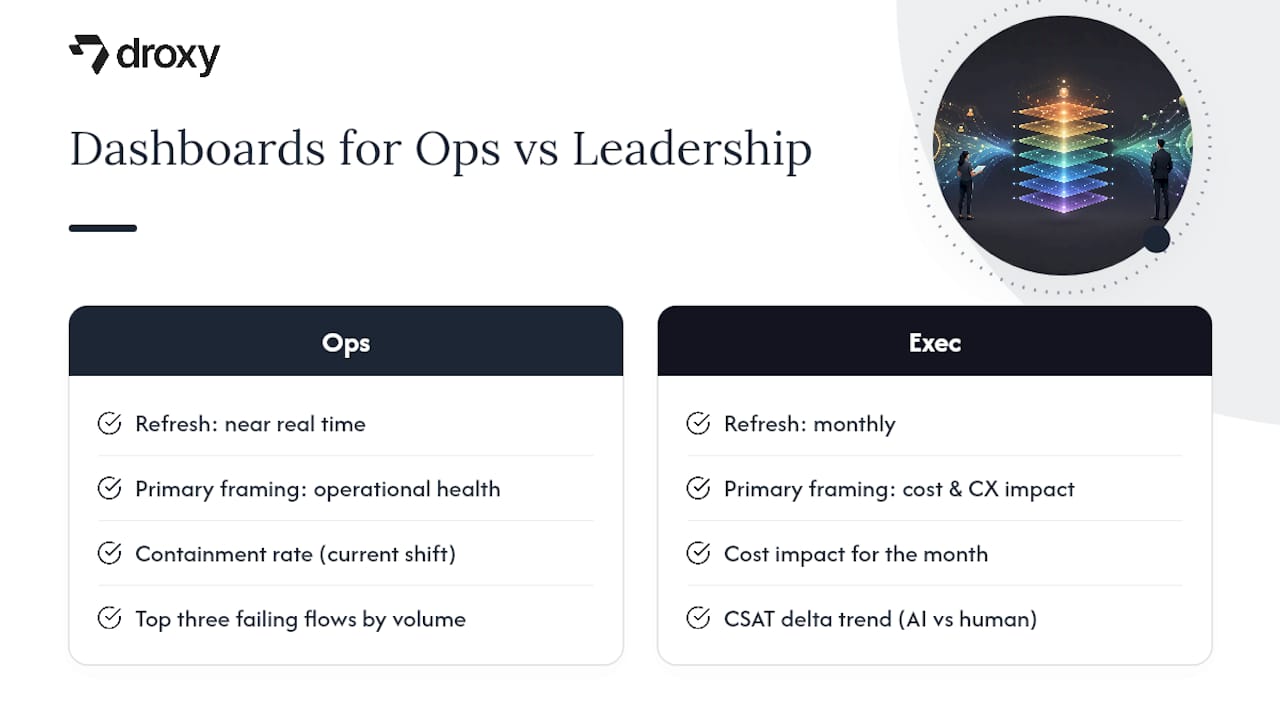
Your operational dashboard should update in near real time and show: containment rate for the current shift, the top three failing flows by volume, escalation reasons ranked, active incidents, latency and error rates, and the most recent sampled hallucinations flagged for review.
Your executive scorecard, refreshed monthly, should translate all of that into business language: cost impact for the month, the CSAT delta trend (AI-resolved versus human-resolved), the automation adoption curve, and a short list of governance incidents with remediation status. AI Agent Square’s benchmark guidance recommends exactly this kind of cost-and-CX-first framing for leadership reports, since a raw containment percentage means nothing to a CFO without a dollar figure attached to it.
For tooling, most teams pair a BI layer (Looker, Tableau, or Google’s Data Studio) with an observability platform (Grafana or Datadog) for latency and error tracking, plus an LLM tracing tool like LangSmith for prompt-level debugging. Collect CSAT directly in-chat right after resolution rather than through a delayed email survey; response rates drop sharply once the customer leaves the conversation.
One more thing that gets skipped until it’s a problem: pseudonymize personally identifiable information before it hits any dashboard, keep labeled quality samples for audit purposes, and set retention periods that match your industry’s privacy rules.
How Do You Turn These Metrics Into Ongoing Improvement?
Metrics that sit in a dashboard and never trigger a decision aren’t worth collecting. Build a rhythm around them.
Set a review cadence. Check alerts daily. Review flow-level metrics weekly. Run root-cause deep dives monthly. Bring the executive scorecard to leadership quarterly.
Assign real owners. An ops lead owns day-to-day alerts, a product owner owns flow performance, and a compliance owner owns policy violations and override reporting, each with a defined SLA for how fast a flagged issue gets fixed.
Run the improvement loop on repeat: measure, identify the top gap, update the knowledge base or prompt or flow, simulate the change against historical data, deploy, then re-measure. This is the same loop that produces the 30% to 50% fallback reduction mentioned earlier, applied continuously instead of once.
Keep a governance checklist running at all times: policy-violation monitoring, human override reporting, model version tracking with drift detection, and audit trails for any high-risk action the agent takes.
Pro Tip: Simulate every flow change against last month’s real conversation logs before pushing it live. It catches regressions in an afternoon instead of a week of live customer complaints.
How Droxy Fits This Measurement Framework
Droxy deploys AI agents across website chat, phone, WhatsApp, Instagram, Facebook, and Shopify from one no-code platform, which means every KPI layer above gets fed from a single, consistent data source instead of six disconnected tools. Its analytics track containment, engagement, and conversion side by side, and deep customization keeps responses on-brand as you tune flows against the data. That consistency is a big part of why over 60,000 users run their customer service through Droxy today.
Start small: pilot one high-volume flow, instrument the event set from the checklist above for 30 days, then compare containment, CSAT, and cost per resolution against your baseline.
My 90-Day Plan for Getting This Right
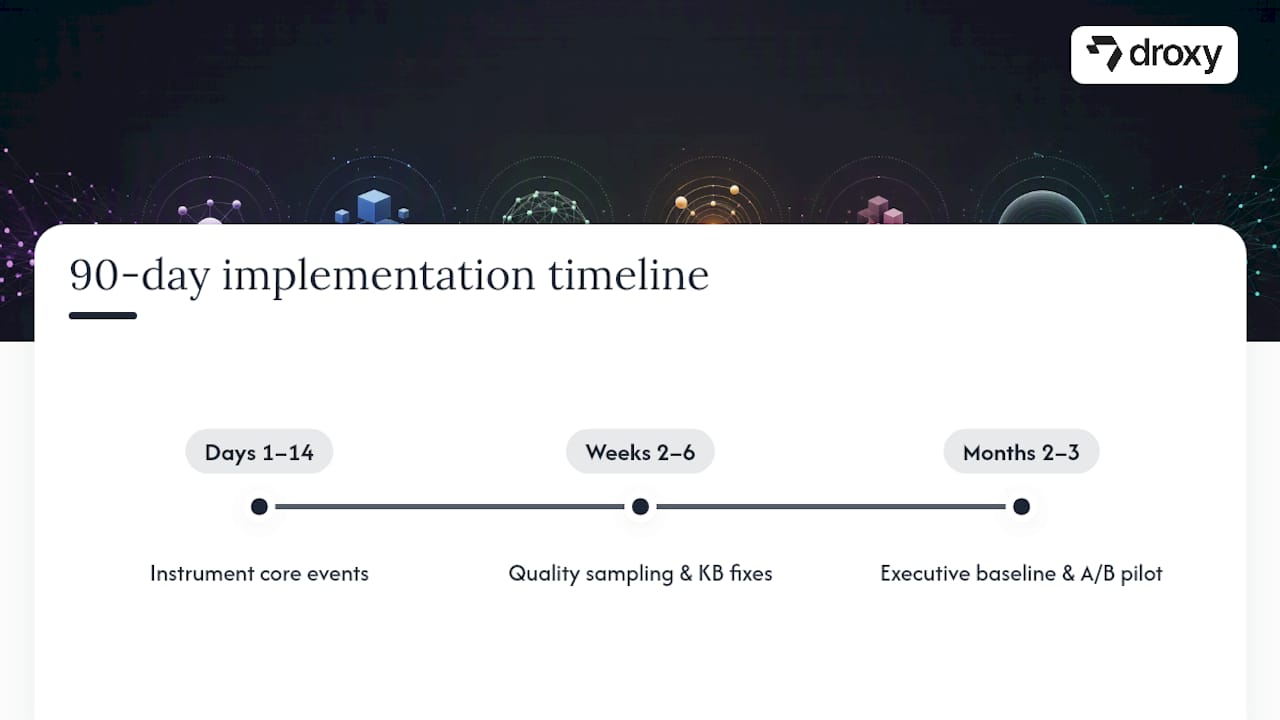
Here’s the sequence I’d run if I were starting from zero. Days 1 through 14: instrument the core event set. Session IDs, issue tags, confidence scores, timestamps. Nothing downstream works without this. Weeks 2 through 6: turn on quality sampling and start the top-10 KB fix cycle in parallel. Months 2 through 3: run your first executive baseline report and pilot an A/B test on one flow.
Three wins you can grab immediately, before any of that structure is fully built: add an in-chat CSAT prompt right after AI resolution, fix your ten most common fallback topics this week, and confirm full conversation context passes to the human agent on every handoff.
Watch containment next to repeat-contact rate and Customer Effort Score from day one. Containment climbing while repeat contacts also climb is not success. It’s a bot getting good at ending conversations instead of solving problems.
— Elena
Ready to Put This Framework Into Practice?
Most teams delay AI agent analytics because they’re juggling five disconnected tools: one for chat logs, another for call transcripts, a third for CSAT surveys. Droxy collapses that into one no-code platform, so the containment, CSAT, and cost-per-resolution numbers above come from the same system your agent actually runs on, across chat, phone, WhatsApp, Instagram, Facebook, and Shopify.
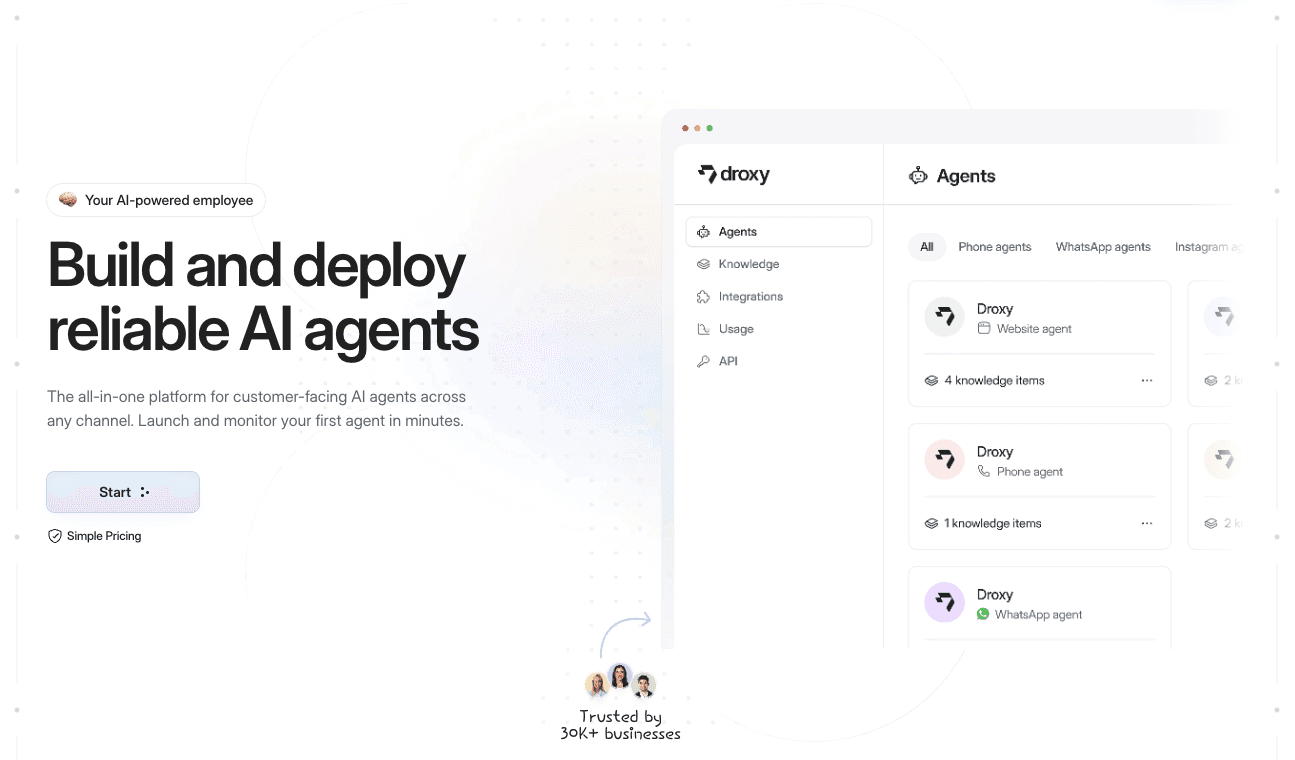
Droxy integrates with your existing systems, hands off full conversation context to human agents when needed, and lets you customize responses down to tone and phrasing so the data you collect reflects a real brand experience, not a generic bot. If you’re running an agency, the white-label agency option lets you resell this same framework under your own brand. If WhatsApp is your primary support channel, the WhatsApp agent plugs into the same analytics stack.
Pricing options are is available at droxy.ai/pricing. The practical next step: pick your highest-volume flow, run it through Droxy for 30 days, and measure containment, CSAT delta, and cost per resolved interaction against what you have today. You can start that pilot directly from the Droxy plan page.
Sources
Essential KPIs for Agentic AI CX: Measuring Success in the Digital Era | NiCE
Chatbot analytics guide: how to track and improve chatbot performance | eesel AI
AI Customer Service Metrics: The KPIs That Actually Matter | aiagentsquare
AI Agent Performance Metrics: 5 Contact Center KPIs You Must Track | Rasa Blog
Recommended
AI agent analytics measures whether your AI customer agent actually resolves issues, protects the customer experience, and lowers cost, not just how many chats it handles. The discipline runs on six KPI layers: containment and resolution, quality and safety, customer experience, agent experience, automation path analytics, and business value. Track all six together, because a business owner who only watches containment will miss the moment “efficient” starts meaning “frustrating.”
TL;DR:
Focusing solely on containment rate can overlook issues like fallback prevalence and customer satisfaction, which require tracking solution rate and journey completion.
Implementing issue-level tagging and weekly quality sampling helps identify specific workflow failures and reduces fallback rates by up to 50 percent.
Real-time operational dashboards should monitor containment, escalation reasons, and hallucinations, while monthly executive reports must translate data into cost and satisfaction impacts.
Building a continuous improvement cycle involves daily alerts, ownership assignments, flow updates, and regression testing against historical logs before deploying changes.
Using an integrated no-code platform like Droxy streamlines KPI collection across channels, enabling quick pilot tests and consistent performance measurement.
Table of Contents
What Is AI Agent Analytics, and Which KPIs Matter Most?
What Should You Instrument to Measure AI Agent Performance?
How Do You Build Dashboards That Ops and Leadership Both Trust?
How Do You Turn These Metrics Into Ongoing Improvement?
How Droxy Fits This Measurement Framework
My 90-Day Plan for Getting This Right
Ready to Put This Framework Into Practice?
Sources
What Is AI Agent Analytics, and Which KPIs Matter Most?
AI agent analytics is the practice of measuring performance, usage, and business impact for AI agents handling customer conversations across chat, phone, WhatsApp, and social channels. NiCE’s six-layer framework organizes this into core operations, customer effort, agent experience, automation analytics, risk and governance, and business value, and it’s become the closest thing this space has to a standard.
Here’s how each layer breaks down into specific KPIs, formulas, and healthy target ranges.
Core operational KPIs track speed and throughput:
Time-to-first-response: seconds to first meaningful reply. Healthy AI benchmarks sit under 5 seconds for chat.
Effective average handle time (AHT), rethought for AI: measure resolution time per issue, not per message, since a single AI conversation often replaces three human touches.
Throughput and service level: conversations handled per hour versus the percentage answered within your target window.
Customer effort and experience KPIs catch what containment hides:
Customer Effort Score (CES): a one-question survey (“How easy was it to resolve your issue?”) asked right after AI-led resolution.
CSAT segmented by AI involvement: compare satisfaction for fully-automated resolutions versus human-assisted ones, not one blended score.
Journey completion rate: did the customer finish the task, or abandon mid-flow?
Repeat contact rate: the customer coming back within 48 hours about the same issue is the clearest sign that “resolved” wasn’t real.
Agent experience KPIs matter when AI hands off to humans:
Agent experience index: a composite of handoff friction and rework time.
After-call work (ACW) reduction: minutes saved on notes and follow-up when AI pre-fills case context.
Human override rate: how often a human corrects or reverses an AI action.
Time-to-competency: how fast new agents ramp up when AI handles routine volume.
Automation analytics goes beyond simple containment. Rasa recommends treating solution rate, meaning customer-confirmed resolution, as the north star instead of raw containment percentage, because containment counts a conversation that ended, not one that actually solved anything. Track fallback rate (how often the agent punts to a human or a generic answer) and automation path analytics: which decision paths customers take most, and where loops occur.
Quality and safety KPIs protect the brand: hallucination rate, KB hit rate (how often a real knowledge-base article backed the answer), policy violation rate, and confidence-threshold breach rate (how often the agent answered despite low confidence).
Business value KPIs close the loop: cost per resolved interaction, deflection rate, revenue impact from AI-assisted conversions, and payback period on the deployment itself.
What Should You Instrument to Measure AI Agent Performance?
Good analytics starts with good logging. If you’re not capturing the right events at the conversation level, no dashboard downstream will save you.
Log the core event set for every interaction: session ID, hashed customer ID, channel, entry point, one or more issue tags, a KB-hit boolean, a confidence score, an escalation flag, timestamps for key events (first response, resolution, handoff), and a cost marker per interaction.
Tag at the issue level, not just the conversation level. Rasa’s guidance on contact center metrics is blunt about this: a single conversation can touch three separate issues, and conversation-level tracking blends success and failure into a number that means nothing. Issue-level tagging shows you exactly which workflow broke, even inside a conversation that “looks” resolved.
Run a weekly quality sample. Pull 50 to 200 responses, weighted toward edge cases and low-confidence answers, and have a human or an LLM-assisted reviewer label each for hallucination, partial correctness, or full accuracy. This is how you actually compute a hallucination rate instead of guessing at one.
Export top fallback topics every week and run a top-10 KB update cycle. eesel AI’s benchmark work found that fixing the ten most common fallback topics typically cuts fallback rate by 30% to 50% per cycle, which is the single highest-leverage habit in this whole framework.
That’s where hallucinations cluster, and it’s where five minutes of review time finds the most problems.*
How Do You Build Dashboards That Ops and Leadership Both Trust?
Different audiences need different views of the same data, and trying to serve both with one dashboard usually serves neither.
Your operational dashboard should update in near real time and show: containment rate for the current shift, the top three failing flows by volume, escalation reasons ranked, active incidents, latency and error rates, and the most recent sampled hallucinations flagged for review.
Your executive scorecard, refreshed monthly, should translate all of that into business language: cost impact for the month, the CSAT delta trend (AI-resolved versus human-resolved), the automation adoption curve, and a short list of governance incidents with remediation status. AI Agent Square’s benchmark guidance recommends exactly this kind of cost-and-CX-first framing for leadership reports, since a raw containment percentage means nothing to a CFO without a dollar figure attached to it.
For tooling, most teams pair a BI layer (Looker, Tableau, or Google’s Data Studio) with an observability platform (Grafana or Datadog) for latency and error tracking, plus an LLM tracing tool like LangSmith for prompt-level debugging. Collect CSAT directly in-chat right after resolution rather than through a delayed email survey; response rates drop sharply once the customer leaves the conversation.
One more thing that gets skipped until it’s a problem: pseudonymize personally identifiable information before it hits any dashboard, keep labeled quality samples for audit purposes, and set retention periods that match your industry’s privacy rules.
How Do You Turn These Metrics Into Ongoing Improvement?
Metrics that sit in a dashboard and never trigger a decision aren’t worth collecting. Build a rhythm around them.
Set a review cadence. Check alerts daily. Review flow-level metrics weekly. Run root-cause deep dives monthly. Bring the executive scorecard to leadership quarterly.
Assign real owners. An ops lead owns day-to-day alerts, a product owner owns flow performance, and a compliance owner owns policy violations and override reporting, each with a defined SLA for how fast a flagged issue gets fixed.
Run the improvement loop on repeat: measure, identify the top gap, update the knowledge base or prompt or flow, simulate the change against historical data, deploy, then re-measure. This is the same loop that produces the 30% to 50% fallback reduction mentioned earlier, applied continuously instead of once.
Keep a governance checklist running at all times: policy-violation monitoring, human override reporting, model version tracking with drift detection, and audit trails for any high-risk action the agent takes.
Pro Tip: Simulate every flow change against last month’s real conversation logs before pushing it live. It catches regressions in an afternoon instead of a week of live customer complaints.
How Droxy Fits This Measurement Framework
Droxy deploys AI agents across website chat, phone, WhatsApp, Instagram, Facebook, and Shopify from one no-code platform, which means every KPI layer above gets fed from a single, consistent data source instead of six disconnected tools. Its analytics track containment, engagement, and conversion side by side, and deep customization keeps responses on-brand as you tune flows against the data. That consistency is a big part of why over 60,000 users run their customer service through Droxy today.
Start small: pilot one high-volume flow, instrument the event set from the checklist above for 30 days, then compare containment, CSAT, and cost per resolution against your baseline.
My 90-Day Plan for Getting This Right
Here’s the sequence I’d run if I were starting from zero. Days 1 through 14: instrument the core event set. Session IDs, issue tags, confidence scores, timestamps. Nothing downstream works without this. Weeks 2 through 6: turn on quality sampling and start the top-10 KB fix cycle in parallel. Months 2 through 3: run your first executive baseline report and pilot an A/B test on one flow.
Three wins you can grab immediately, before any of that structure is fully built: add an in-chat CSAT prompt right after AI resolution, fix your ten most common fallback topics this week, and confirm full conversation context passes to the human agent on every handoff.
Watch containment next to repeat-contact rate and Customer Effort Score from day one. Containment climbing while repeat contacts also climb is not success. It’s a bot getting good at ending conversations instead of solving problems.
— Elena
Ready to Put This Framework Into Practice?
Most teams delay AI agent analytics because they’re juggling five disconnected tools: one for chat logs, another for call transcripts, a third for CSAT surveys. Droxy collapses that into one no-code platform, so the containment, CSAT, and cost-per-resolution numbers above come from the same system your agent actually runs on, across chat, phone, WhatsApp, Instagram, Facebook, and Shopify.
Droxy integrates with your existing systems, hands off full conversation context to human agents when needed, and lets you customize responses down to tone and phrasing so the data you collect reflects a real brand experience, not a generic bot. If you’re running an agency, the white-label agency option lets you resell this same framework under your own brand. If WhatsApp is your primary support channel, the WhatsApp agent plugs into the same analytics stack.
Pricing options are is available at droxy.ai/pricing. The practical next step: pick your highest-volume flow, run it through Droxy for 30 days, and measure containment, CSAT delta, and cost per resolved interaction against what you have today. You can start that pilot directly from the Droxy plan page.
Sources
Essential KPIs for Agentic AI CX: Measuring Success in the Digital Era | NiCE
Chatbot analytics guide: how to track and improve chatbot performance | eesel AI
AI Customer Service Metrics: The KPIs That Actually Matter | aiagentsquare
AI Agent Performance Metrics: 5 Contact Center KPIs You Must Track | Rasa Blog
Recommended


🚀
Powered by Droxy
Turn every interaction into a conversion
Customer facing AI agents that engage, convert, and support so you can scale what matters.
✨
Learn more
Recent posts
Insights
3 min read
Introducing Agent Memories
Improve your agents' performance with Agent Memories. Prevent agents from repeating the same mistakes by giving them feedback.
Read more

Insights
15 min read
HVAC Marketing in 2025: The Definitive Lead Gen Guide
Discover 15 proven HVAC marketing strategies, plus learn how Droxy's AI website agent converts curious visitors into qualified leads by answering their questions instantly - right when they're most interested in your services.
Read more
Insights
10 min read
10 Best AI Sales Agents in 2025: Tested & Ranked
Discover the top 10 AI sales agents of 2025, designed to enhance lead generation, personalize outreach, and ultimately, close more deals
Read more
Insights
3 min read
Introducing Agent Memories
Improve your agents' performance with Agent Memories. Prevent agents from repeating the same mistakes by giving them feedback.
Read more
Insights
15 min read
HVAC Marketing in 2025: The Definitive Lead Gen Guide
Discover 15 proven HVAC marketing strategies, plus learn how Droxy's AI website agent converts curious visitors into qualified leads by answering their questions instantly - right when they're most interested in your services.
Read more